Why Clients Leave (And the Dashboard That Keeps Them)

Why Clients Leave (And the Dashboard That Keeps Them)
Most clients do not leave because the work is bad. They leave because they cannot see it.
You are heads down building. You go quiet. And in that quiet, the client starts to wonder. Is anything happening? Did I pick the wrong people? That worry grows. And then they leave. Even when you were doing a great job the whole time.
So today I want to fix that. I will show you a simple dashboard your client logs into. It shows them real numbers, on their own, any time they want. And I will show you how to build one yourself in about an hour.
And if you are wondering who this is, fair question. I run an AI automation business. I have helped a lot of agencies grow and make more money with AI. My own client churn is close to zero. This is one of the main reasons why.
Silence is what makes clients leave
So here is the thing nobody says out loud. Silence equals churn.
You get busy doing the actual work. So you go quiet on the client. I have seen this happen so many times. The client sits there with nothing to look at. Especially early, on a new project. They start to think they made a mistake. It feels bad. And a bad feeling is enough to make them walk, even when the work is good.
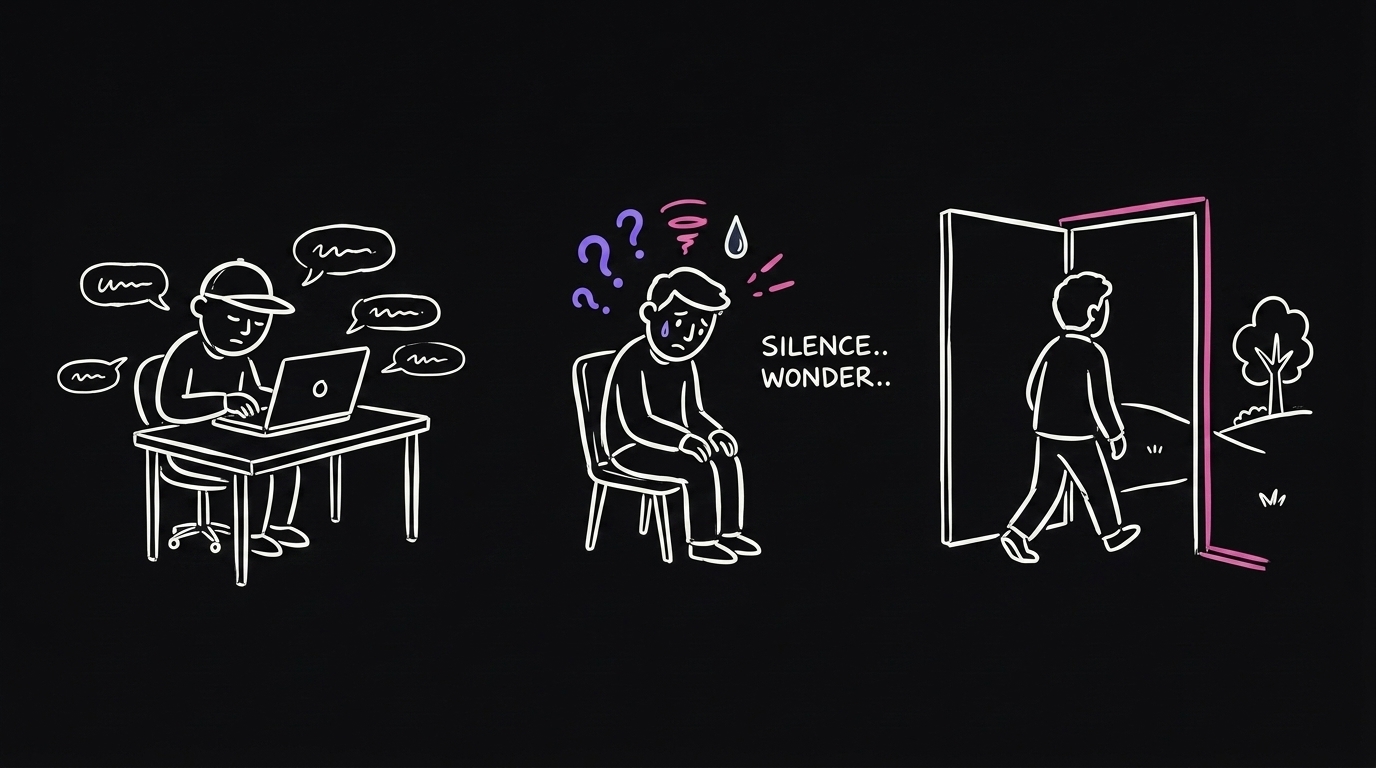
So before they leave, you will usually feel it first. They start asking for updates. Hey, any news on this? Where are we? Is this working? Every one of those messages is a warning sign.
Doing good work is not the same as them seeing it
There is a very big difference between doing a good job and the client feeling like you are doing a good job.
Almost everyone can do the first one. Almost nobody does the second one well. And the second one is what keeps the money coming in. You could run a great campaign and still lose the account, just because the client never got to feel it.
So the job is not only to do good work. It is to make the good work easy to see.
Words prove nothing. Numbers prove everything.
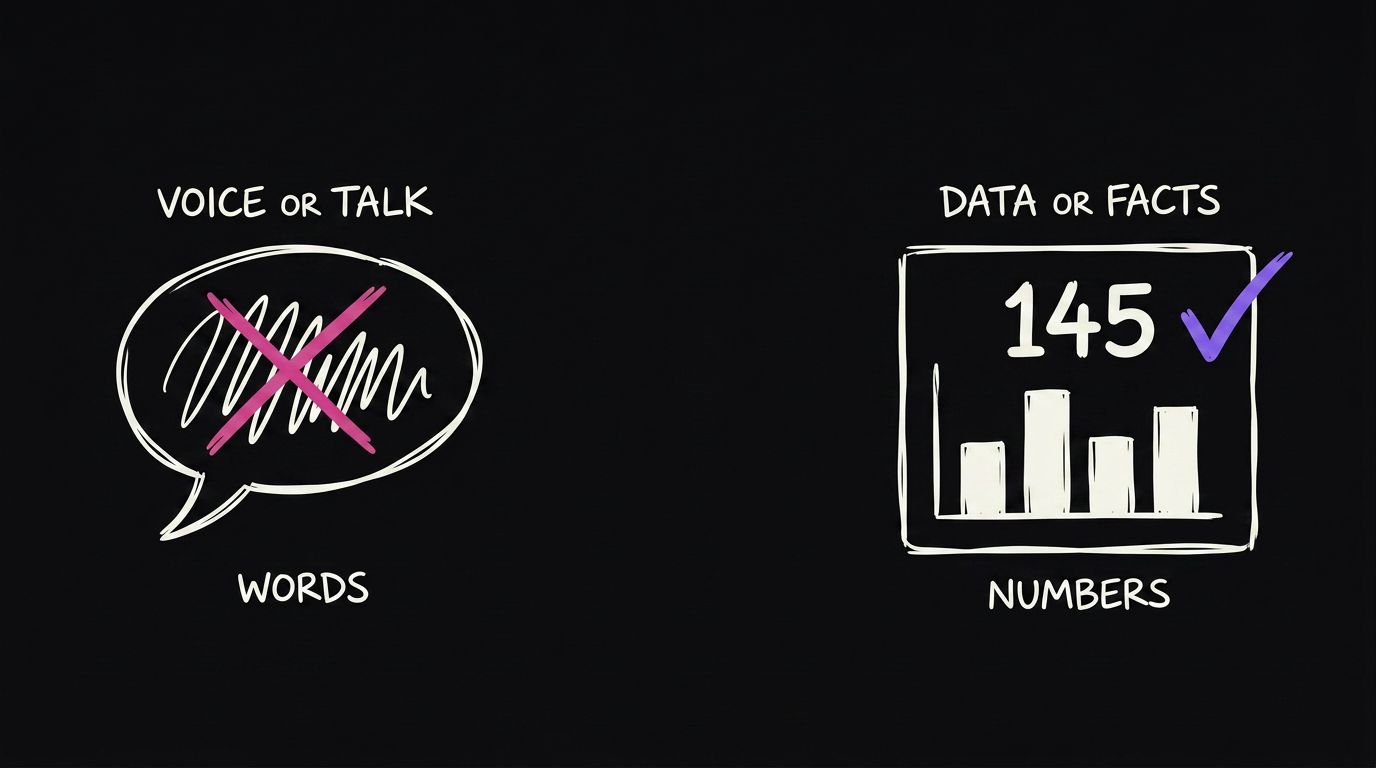
So most people try to fix the silence with an update. You send a message. Hey, we are working on the ads. The results are looking good. This or that.
But that proves nothing. It is just words. The client cannot tell if their money is working. It is a promise, not proof.
The fix is numbers. Real data the client can look at. When they see the numbers, they stop wondering. Because a number is proof, and a sentence is not.
| The old way | What the client feels | The dashboard way |
|---|---|---|
| A status email that says "going well" | Nice words, but is it true? | A page they log into, full of real numbers |
| You write it by hand every week | Slow for you, vague for them | It updates on its own |
| No numbers behind any of it | Cannot tell if the money works | Leads, cost per lead, ROAS, show rate, all live |
| Feels like homework | They still worry | They see proof, so they relax and stay |
Give them a dashboard they log into
So here is what I mean. A page the client logs into any time they want.
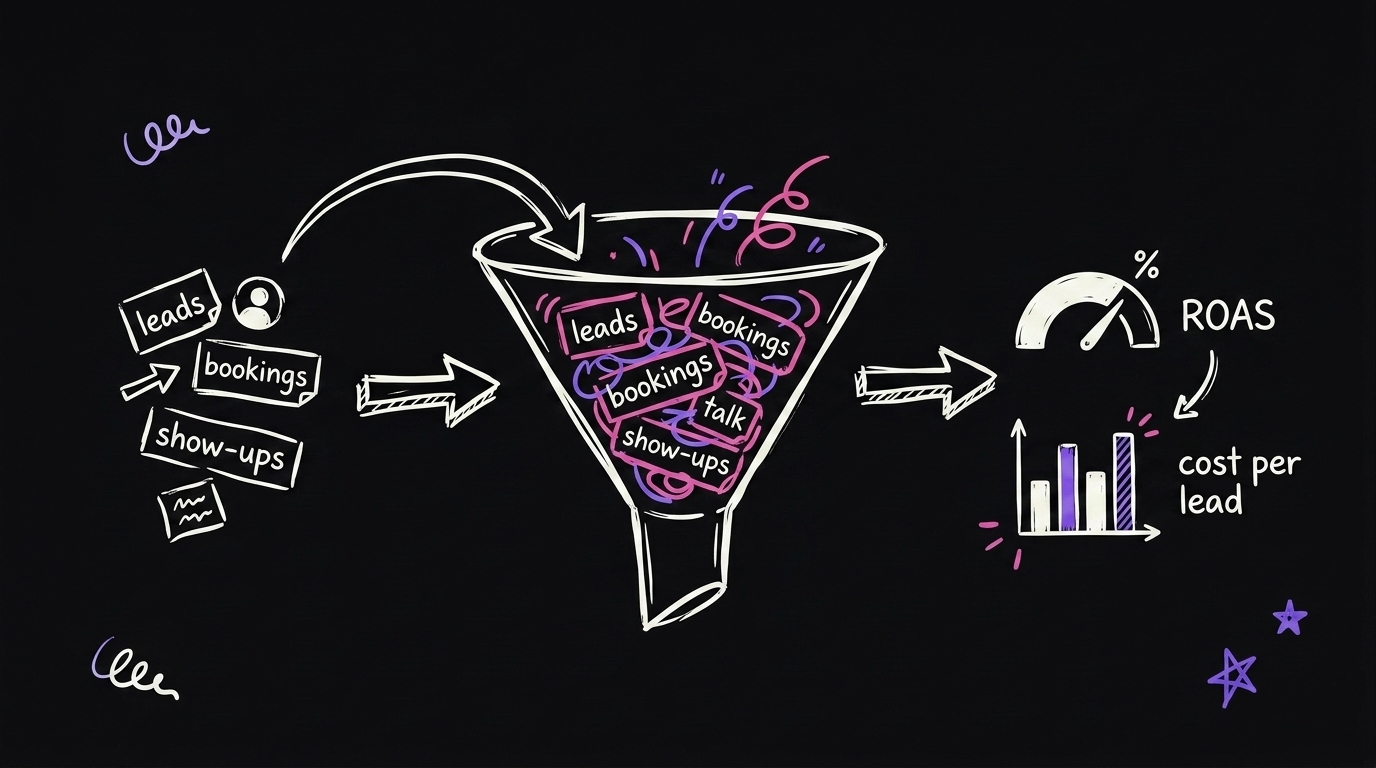
It connects to the tools you already use. The ad account. The CRM where the bookings live. Then it pulls the numbers in and shows them. So the client logs in and sees it all. We got 86 leads. 44 consultations booked. Here is the show rate. Here is the cost per lead. Here is the ad spend.
They see the raw numbers and the money numbers, side by side. No email needed. No waiting on you. The proof is just there.

It does two jobs at the same time
So this dashboard is not just for them. It does two things at once.
One, it proves you are doing a good job. The client relaxes and stays.
Two, it shows YOU what is actually working. And here is a piece most people miss. Some data you cannot pull from an app. Like what happened on a sales call. So you give the client a login and let them mark it themselves. Showed up or no show. Closed or not closed.
And here is how you get them to do it. You tell them straight. This is for you. The more you fill in, the better we can see what is converting, and the better we spend your money. It is not extra work for them. It is better results for them.
The two kinds of data: inputs and outputs
So what do you actually need to build this? First, data. If there is no data, nothing shows. And data is really two things.
Inputs are the raw stuff coming in. Leads, bookings, show ups. The things you already track, or want to track.
Outputs are what you calculate from those inputs. ROAS. Cost per lead. Close rate. The inputs are the ingredients. The outputs are the numbers that tell the story. A good dashboard shows both.
You can build this yourself with 4 free tools
So you do not need a developer for this. You need four tools, and you may already know them.
| Tool | What it does |
|---|---|
| GitHub | Where the code for the dashboard lives |
| Supabase | The database that stores your inputs |
| Vercel | Hosts the dashboard so the client can open it |
| Claude Code | Builds it and wires everything together |
Three of them are free to start. GitHub, Supabase, Vercel. Claude Code is the only paid one. But it is the highest return thing you will spend money on all month. If you are not using it yet, start.

The exact steps
So here is what you actually do, start to finish.
First, figure out what data you want to show. Just make a list.
Second, open Claude Code and tell it what you want. Something like this:
I want to build a simple dashboard my clients can log into.
It should show this data: [list your inputs and outputs].
The data comes from here: [your ad account, your CRM].
Walk me through every step to build it, one at a time.
Then it tells you everything. It says okay, for the ad numbers we need the ad account connected, here is how. You follow the steps. It gives you every single one, even if you are not technical. For your first client, you can finish this in about an hour. After that, you make it your own and improve it.
I put this exact prompt, plus a working demo dashboard you can poke at, in a free repo. Grab it here: github.com/qemoza/client-dashboard-starter. The live demo is right here.
The result
So this one thing changed my business. My churn is very, very low. I have had zero clients leave that I chose to keep. The only account that ever left, I let go myself.
Because when the client can see the proof, they stop wondering. They stop chasing you for updates. And they keep paying. Every time they check, the answer is right there. And it is a number, not a sentence.
FAQ
Why do clients leave even when the work is good? Because they cannot see the work. You get busy and go quiet, so the client has nothing to look at. They start to worry they made the wrong choice. That worry, not the quality of the work, is what makes them leave.
What should a client dashboard show? Two kinds of numbers. Inputs, which are the raw data like leads, bookings, and show ups. And outputs, which you calculate from them, like ROAS, cost per lead, and close rate. Both, side by side, updating on their own.
How is a dashboard better than a weekly update email? An email is your word. A dashboard is proof. The email is slow to write and easy to doubt. The dashboard has real numbers the client can check any time, so they stop wondering and stop chasing you.
Do I need to be technical to build one? No. You use four tools, three of them free to start, and Claude Code walks you through every step. For your first client you can build it in about an hour, even with no coding background.
How does letting the client mark results help me? Some data, like whether a sales call showed up or closed, cannot be pulled from an app. When the client marks it in the dashboard, you get the exact data you need to see which ads actually work, so you can spend their money better.
Want more like this?
So I am breaking the whole thing down, step by step. If you want more like this, follow along on qemoza. There is a lot more I want to show you. Let's build.
Written by Hamza Oulad, founder of qemoza, the AI ops partner for agencies. Built with Finn.